How School Districts Can Include Equity When Choosing Where to Deploy Electric School Buses First
Some communities have borne a greater portion of the impact of diesel school bus exhaust pollution -- that’s why equity must be a central factor when determining where the benefits of electric school buses are felt first. Here’s what to know.

As more electric school buses hit the road, district officials and school transportation providers are deciding how these new electric vehicles will fit into their existing fleets and which routes they will serve. While technical feasibility is the primary consideration in the decision of which routes to electrify first, there is also the potential for these initial deployments to lessen the disproportionate levels of harmful air pollution faced by communities that have been historically marginalized and by low-income communities. Electric school buses have no tailpipe emissions of dangerous pollutants that can harm students’ health and development and are responsible for lower greenhouse gas emissions than any other type of school bus.
Equitable electric school bus route planning and deployment is about bringing the benefits of zero-tailpipe-emissions to underserved communities that need them most. Here’s how school transportation providers can begin to bring equity considerations and data on air quality, income, race and accessibility into their operational planning for school bus electrification.
How do districts typically decide which buses to electrify first?
When matching new electric school buses to existing bus routes, school transportation providers will need to align vehicle specs with district service requirements and local operating conditions. State of charge and battery size are key factors that determine the length of route an electric school bus can drive, but range is also impacted by the topography of the route, the climate of the area, the time of year, the number of stops and turns, and use of onboard heating and cooling systems. Other important considerations include the location where the bus is stored when not in use and the number of routes the bus completes daily (including midday and extracurricular routes), which impact charging opportunities. Transportation providers must work with the local electric utility to ensure that the underlying grid infrastructure is able to support changing electricity needs.
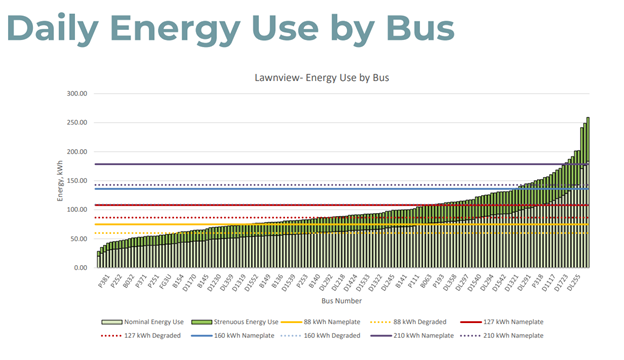
Often, transportation providers will opt to place new electric school buses on the shortest routes due to concerns about the bus’s battery range, or on routes that return to a depot for several hours in the middle of the day to enable midday charging. Below is an image from a route feasibility analysis the Center for Transportation and Environment completed on behalf of Dallas Independent School District. The analysis maps each route’s daily energy use (as determined by route length) against various bus battery sizes, operating conditions and battery degradation levels.
More information on charging infrastructure and operations planning can be found in the Electric School Bus Initiative’s Step-by-Step Guide to School Bus Electrification. Districts looking to learn about their specific bus and its battery can check the Electric School Bus Initiative's 2023 Electric School Bus Market Study or contact the vehicle manufacturer.
Why incorporate equity considerations into route planning?
At its core, equitable route planning and deployment is about bringing the benefits of zero-tailpipe-emissions to the communities that need them most. The first step is to consider who will be driving and riding the new electric school buses, and where those buses will travel to and from.
While the technical capabilities of the bus are a non-negotiable when determining which routes an electric school bus can run, current approaches to electric school bus route selection often fail to fully consider the benefits an electric school bus can provide to the district and community financially, environmentally and socially. Electric school buses now have nameplate ranges of up to 210 miles on a single charge; and while the usable range is lower than the nameplate range, current models have the ability to cover most routes in operation today. In fact, one study found an average school bus route to be 32 miles long with 80% of routes analyzed being shorter than 40 miles. The longest route observed by this study was 127 miles. With thoughtful planning, electric school buses are more than capable of driving longer routes which can enable them to save districts money on fueling costs.
In addition, longer routes in diesel buses expose bus drivers and students to harmful tailpipe emissions for extended periods of time, making electric school buses a preferable alternative. Studies have proven that exposure to diesel exhaust emissions can impact the cognitive and physical development of children, decrease school attendance rates and increase rates of cancer and other serious illnesses. Students from Black households, low-income students and students with disabilities are more likely to ride a bus to school, increasing their exposure to harmful diesel exhaust. Furthermore, impacts are not only felt by those on the bus but contribute to the pollution in communities through which the buses travel. This is especially a problem for communities of color and low-income neighborhoods where research has shown there to be a greater concentration of air pollution exposure, especially from transport sources like buses.
As electric school buses roll out and their benefits become more recognized, community members, parents, students, drivers, school board members and others will want to know the process for determining which routes have been electrified. Developing a thoughtful bus replacement process that incorporates technical feasibility and equity data like local PM2.5 quality, income level, race, and bus accessibility – and communicating it with key stakeholders – can help to not only avoid inequitable outcomes and implementation biases but also strengthen school-community relationship.
How can school districts bring equity considerations into route planning?
There is no “one-size-fits-all” approach to equitable route selection. Each district will need to gather data on local demographics (such as data on income and race), historical and current social context, geography (such as major transportation routes that could cause cumulative burdens to certain neighborhoods), and more to determine the approach that works best for their community. This data can then be applied at the school, depot or route level to support decision making on which routes to electrify first.
Potential approaches for incorporating equity into electric school bus route selection:
School-level Approach
|
Depot-level Approach
|
Route-level Approach
|
Integrating equity into electric school bus route selection and planning can be as simple as choosing to prioritize routes that serve a particular school or originate at a depot located within a certain environmental justice community. For example, Salt Lake City School District targeted early electric school bus deployment in the Rose Park neighborhood, a community on the west side of the city that has faced long-standing air quality and environmental justice issues. The district also chose to electrify four Type A buses that transport students with disabilities and have high idle times and thus, higher emissions.
A more robust approach would be to identify areas of inequality in a community (such as low-income census tracts) that could be addressed by electric school buses, and then work with those stakeholders to prioritize the deployment of electric school buses in a way to maximize their access to benefits. Once a district develops a strategy to determine which routes the electric school buses will be placed on, it is important to clearly communicate the criteria to answer potential questions from parents, community members, drivers, school board members and more about why the electric vehicle was placed where it was.
How can school districts access equity-related data to support route planning and deployment?
Below are three ways that district staff can gather equity-related data to inform discussions on equitable route planning.
1. Use national datasets
- Analyzing publicly-accessible, easy-to-use datasets on air pollution, population demographics and income levels can serve as a good start for transportation providers who are trying to decide for which routes electric school buses would make the largest impact.
- Air pollution levels can help show which neighborhoods are most exposed to harmful pollutants.
- Due to discriminatory laws and practices, today people of color have disproportionately higher exposure to fine particulate matter pollution in the U.S., including more exposure to diesel vehicle exhaust, making racial demographic data a helpful method for determining who may benefit most from electric school buses.
- Areas with higher levels of low-income residents are associated with higher rates of school bus ridership and can indicate whether residents have the means to access medical support if pollution-related health conditions arise.
2. Integrate local knowledge
- Transportation directors, administrators, dispatchers and others involved in route planning decisions can consider local data and knowledge, for example, which routes serve Title 1 schools or schools that participate in a local program to support low-income families, for example by providing fresh food or other services. They can also contact their utility to learn about any disparities in underlying grid infrastructure.
- School transportation providers can use local knowledge on which routes serve those with disabilities, because students who require assistance loading and unloading from school transportation vehicles often spend extended periods of time near idling vehicles as they wait or load near the tailpipe where they are often exposed to higher levels of diesel exhaust pollution.
- School transportation providers who are not employees of the district they serve should consider reaching out to district staff and community leaders before making any evaluations based on local knowledge.
3. Engage stakeholders regularly
- Whenever possible, school districts should engage stakeholders who could benefit from electric school buses to get feedback and refine a plan for matching electric school buses to routes. Groups that may benefit from engagement during the route planning process include those who ride, drive and maintain the bus; those who live near transportation depots or facilities; and those who live in the communities along bus route.
- Community engagement events can be used to evaluate the accuracy of transportation providers’ perceived local knowledge, such as which school populations might face disproportionate burdens related to transportation emissions. Experience-based evidence can be beneficial in adding important context to national datasets. However, it is important that local knowledge is used in coordination with data-driven evidence, as experience-based evaluations can still be susceptible to unintentional bias.
- Engagement can identify community and driver enthusiasm about the opportunity to pilot the new buses and also any potential concerns, which can then be factored into route selection decisions.
- Ways to encourage quality participation during engagement events can include:
-Contacting community leaders to recruit attendees
-Engaging district communications staff to help plan and advertise the event
-Providing incentives such as food, childcare or stipends and supportive event timings for attendance
-Enabling opportunities for in-person and remote participation
More information on stakeholder engagement can be found in the Electric School Bus Initiative's Step-by-Step Guide to School Bus Electrification.
What tools are available to support equity analysis for route planning?
There are a variety of publicly available tools and databases that school districts can use to better understand local income levels, population demographics and levels of air pollution. Below is a sample of two of these mapping tools along with brief instructions on how to navigate them.
1. Understanding Local Air Quality using the Council on Environmental Quality’s Climate and Economic Justice Screening Tool:
- Open tool.
- Toward the top left of the map, there is a search bar. Use this to locate schools, transportation facilities, neighborhoods or specific addresses.
-You can also scroll up to zoom out and down to zoom in on the map. Click and drag to move the map. - Zoom into the locations you want to learn more about.
- Click on the census tract that contains your desired area of analysis.
- On the right side of the screen, you will see whether this area is federally recognized as being disadvantaged.
- Below this, you will see a line of boxes titled: climate change, energy, housing, legacy pollution, transportation, water and wastewater, and workforce development. You may need to hover over the boxes with your mouse and scroll down to see all of them.
- Click on these boxes to expand them and learn where this tract ranks nationally in a variety of categories.
- In the transportation box, make a special note of where this tract ranks in the “Diesel particulate matter exposure” category.
- Compare the tracts in your school districts and use this information to determine which communities would benefit most from a clean electric school bus.
2. Understanding Local Income and Population Demographics using the U.S. Department of Energy's Energy Justice Mapping Tool for Schools:
- Open tool.
- Search or locate your school district.
- Once you have clicked on your school district, select a school from the list underneath the “school” header.
- After you choose a school from your district you should see a header that reads "school indicators.”
- Under "school indicators" there is a table that tells you information about the demographics of you’re the school. If you do not see the table, you may need to select the plus sign to the right of the “school indicators” header.
- Compare the values in the table across all of the schools in your district.
- Consider having your bus serve the route that has the most indicators of a marginalized community.
-These indicators include: Title 1 schoolwide programming eligibility, Free & reduced lunch eligible students, or location in a disadvantaged community (DAC).
Ultimately, equitable route planning is about bringing the benefits of zero-tailpipe-emissions to the communities that need them most – and ensuring that everyone impacted is empowered throughout the process. As a growing percentage of the U.S. school bus fleet goes electric, it’s up to school transportation leaders to ensure that the buses are deployed successfully and in an equitable manner. The approaches above can be tailored and expanded to meet the needs of your district and your community.
Additional Resources:
- Census Data: The U.S. government makes the most recent census data publicly available. Using the search bar, individuals can look up census tracts in their community and get information on their demographic breakdown, mobility, commutes and much more.
- EPA Air Quality Index: Published by the EPA, this tool tracks daily air quality across the United States. Users can search for a location or zoom in on the map to get information on the ozone or particulate matter. Make sure to pay special attention to the air quality indicators in areas that are known to have a significant number of industrial polluters, agriculture or roadways. It is important to remember that air quality can fluctuate. It may be helpful to revisit this tool multiple times to ensure the poor air quality in an area is not just a temporary issue.
- Redlining Tool: Developed at the University of Richmond, this tool identifies areas where redlining took place in the United States. Redlining was a practice in the U.S. in which the government would outline areas in which communities of color – often Black communities – lived and would systematically deny them access to homeownership and lending programs granted under the New Deal. The effects of redlining are still seen today, and this tool identifies communities that were redlined in the past. While likely most useful for districts in urban areas, this tool can be a useful way to identify any neighborhoods in your community that have suffered from discriminatory housing practices.
- Climate and Economic Justice Screening Tool: Published by the White House Council on Environmental Quality, this resource allows users to identify historically disadvantaged communities by census tracts. This tool also provides a variety of indicators of the area's economic and environmental health. More information on using this website can be found in the above “What tools are available to support equity analysis for route planning?” section of this article.
- Energy Justice Mapping Tool for Schools: This resource, created by the Department of Energy, can help transportation providers learn more about the districts and schools they serve. Providing a variety of information such as population demographics, Title 1 eligibility and more, this tool can help transportation providers compare the economic status of different schools. More information on using this website can be found in the above “What tools are available to support equity analysis for route planning?” section of this article.